Histograms in Photography: A Comprehensive Guide
In addition to providing insights into exposure, tonal balance, and color distribution within an image, histograms are an invaluable tool for photographers. In order to take better-exposed and visually compelling photographs, photographers must understand how to interpret histograms. We explore the details of histograms, their significance in photography, and how to use them effectively in this guide.
Histograms: An Introduction

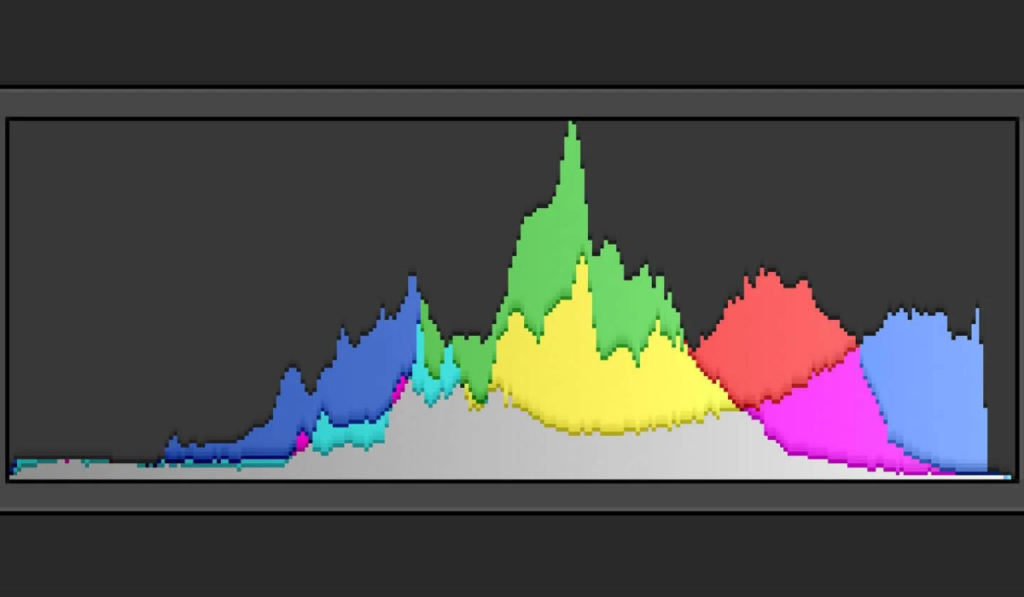
To evaluate exposure and tonal balance, histograms represent tones and frequencies in an image. A vertical axis displays the quantity of tones at each brightness level, with pixel brightness levels ranging from black to white.
Camera Histograms
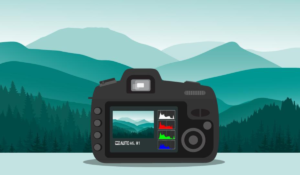
Unlike LCD screens, histograms offer more accurate exposure feedback, which is crucial for preventing underexposure and overexposure. Histograms detect clipped highlights in bright scenes, guiding adjustments to maintain detail. In contrast, histograms prevent underexposure in dark environments by identifying clipped shadows.
Histograms and post-processing
Histograms in editing software are used to adjust exposure, contrast, and color balance in post-processing. In addition to providing insight into color distribution and balance, they provide assistance with color correction and enhancement.
ETTR stands for Exposing to the Right
A technique known as Exposing to the Right (ETTR) involves maximizing exposure without overexposing highlights. In addition to improving image quality, ETTR reduces noise, widens the dynamic range, and enhances color rendition by pushing histogram peaks towards the right edge without clipping highlights.
It’s a guideline, not a rule
Histograms provide valuable guidance for exposure and tonal balance, but they are not rules. In order to achieve desired creative effects, photographers can experiment artistically and deviate from histogram suggestions.
In conclusion
Photographers can improve their creative output by embracing histograms and making informed exposure and tone balance decisions. A photographer can improve the quality and aesthetics of their images by understanding histograms.
Understanding Histograms in General

From black to white, histograms represent an image’s tonal values. On the left side are dark tones, on the right are lighter tones, and in the middle are midtones. Each brightness level is represented by a vertical axis showing how many tones are present.
How to interpret histograms
As the image’s contrast changes, mid-tones often dominate the histogram, with peaks indicating different brightness levels.
Clipping detection
For preserving detail in photography, histograms help identify overexposed (clipped highlights) or underexposed (clipped shadows) areas.
Adjusting the exposure
It involves pushing histogram peaks towards the right without clipping highlights, unlike traditional exposure.
Right-wing Exposure Benefits
As a result of this technique, the dynamic range of an image is extended, noise is reduced, and the color rendition is improved.
Considerations for file formats
Compared to JPEG compression, shooting in RAW preserves all sensor data, which is vital for post-processing adjustments.
Adjustment of brightness
Brightening images without adding excessive noise can be achieved by adjusting exposure settings such as aperture and shutter speed while keeping ISO low.
Techniques for bracketing
Due to JPEG rendering, exposure bracketing captures multiple shots at different exposures for optimal exposure.
Photographers can capture better-exposed images by understanding histograms and adopting techniques such as “Exposure to the Right”. The use of histograms in post-processing or on camera provides valuable insight into image exposure and tonal balance, resulting in visually stunning images.